Video Analytics
Make Better Business Decisions by Leveraging Video Data
Bring the Data Into Your Business
The majority of businesses today are still in the dark. Using their CCTV only to observe, they are missing out on AI-generated insights.
Vision brings data into your business, the same way Google Analytics does for your website. You can make sense of real-time traffic numbers, historic traffic trends, visitor demographics, hot periods and more.
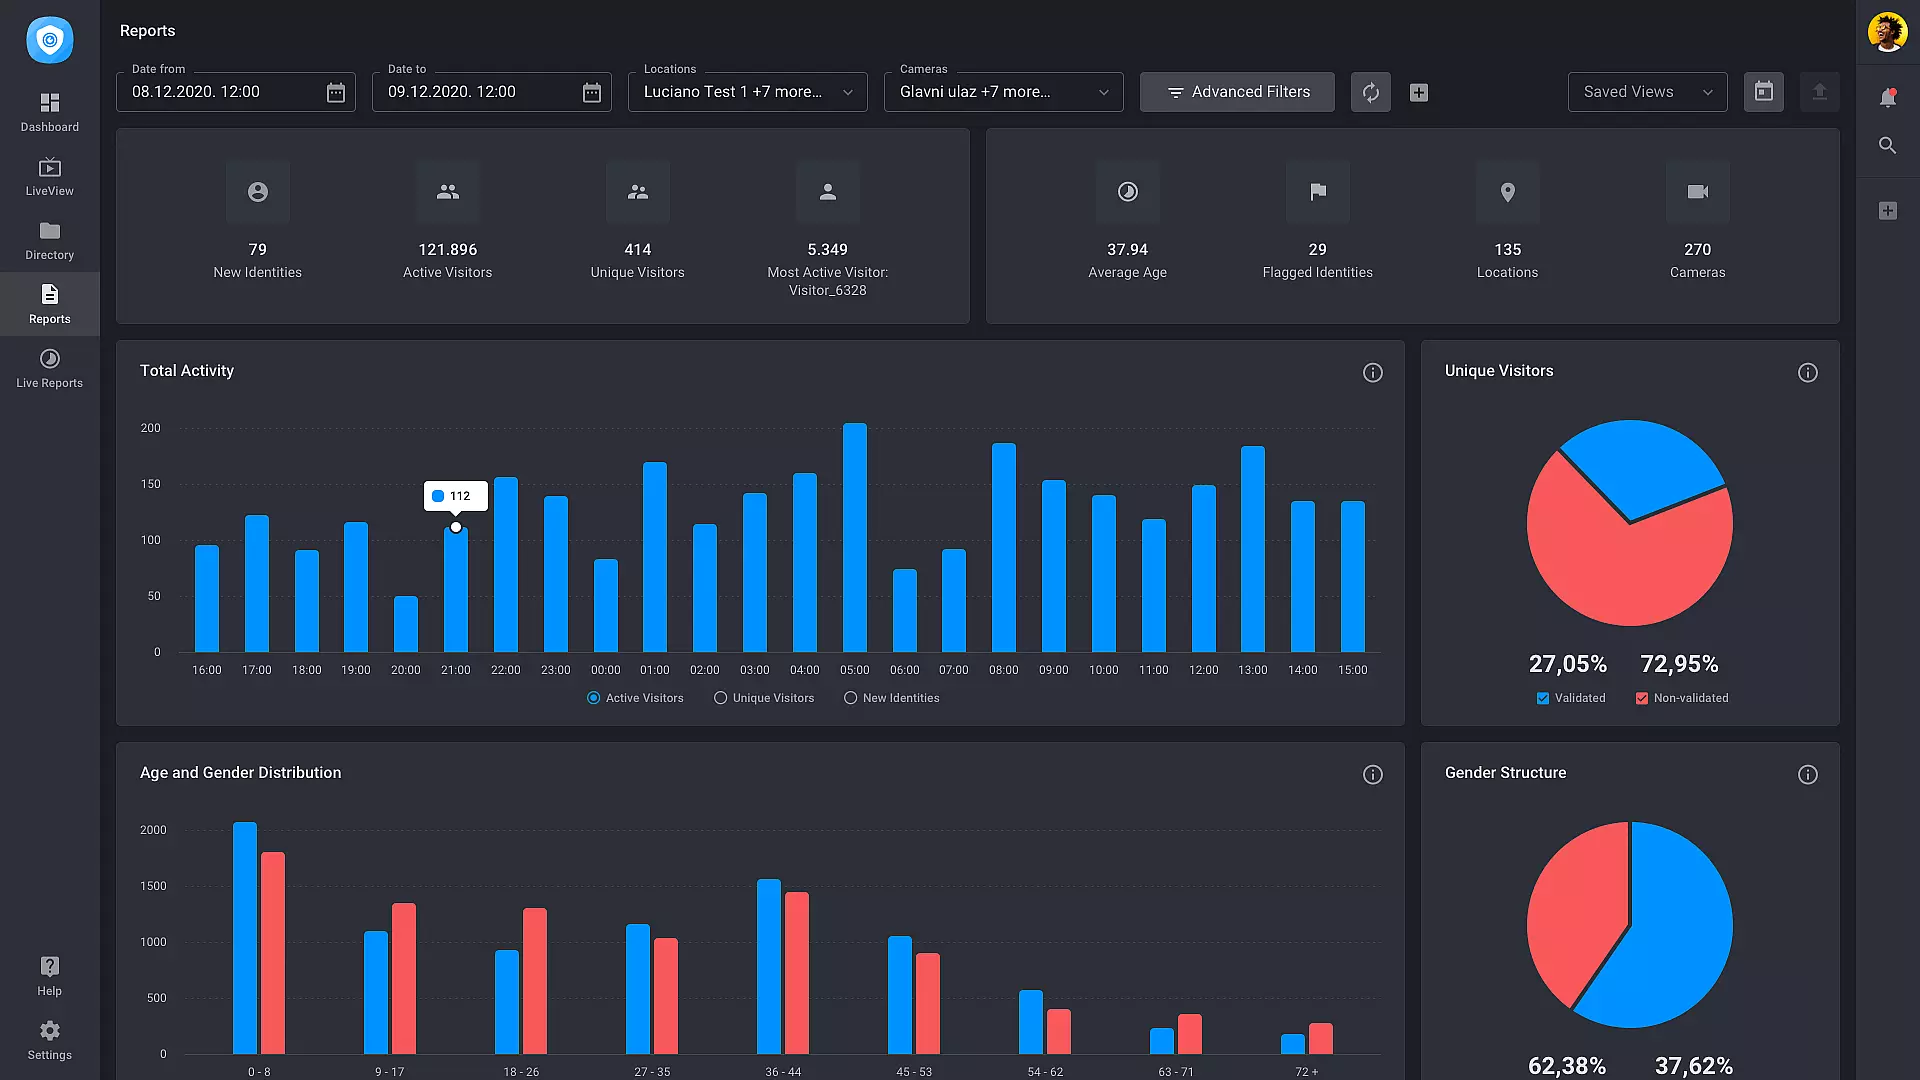
Report Dashboards
Historic Reports
Chose to preview daily, weekly, and monthly reports all within a single dashboard. Understand historic traffic trends, the age and gender of your visitors, and who your most active visitors are.
The dashboard allows you to view reports for cameras and locations that you select.
- Select custom time ranges
- Data export (use the data for BI tools)
- People count data
- Age and gender data
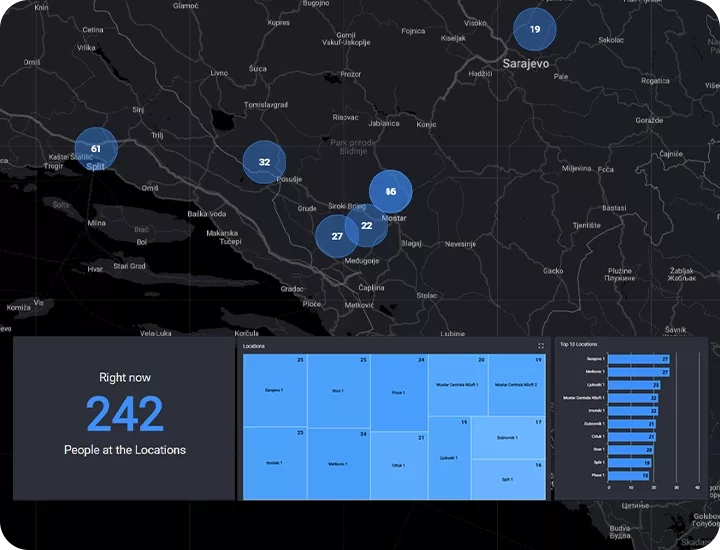
Real-time Reports
Know what is happening across all your locations with live people count data. Not just globally, per-location and per-camera feeds allow you to narrow down your awareness effectively.
The same as with historic reports, you choose what you see based on given user permissions.
- Global traffic map preview
- Top performing locations view
- Top performing camera view
- 5-second refresh rate
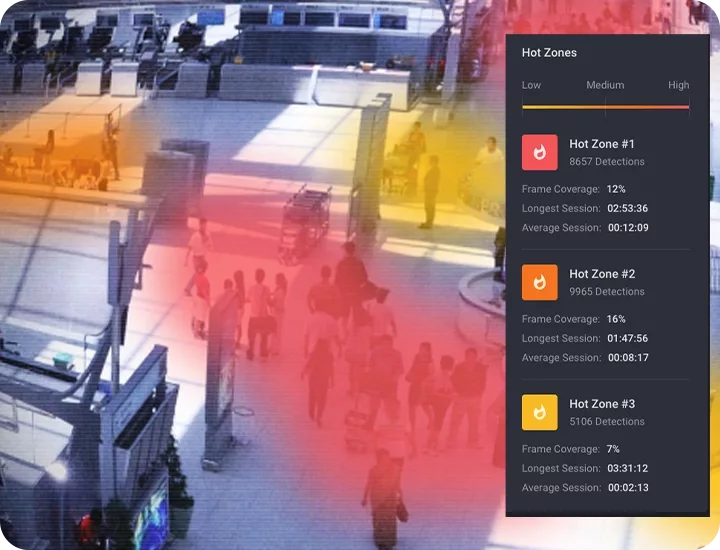
Heat Map Reports
Find out what business areas take away most of your customers' interest. In a visually appealing view, identify hot zones and understand why certain content brings in the highest customer influx.
- Hot zone preview (top traffic areas)
- Visitor session duration (per hot zone)
- Intuitive colouring
Find out what business areas take away most of your customers' interest. In a visually appealing view, identify hot zones and understand why certain content brings in the highest customer influx.
- Hot zone preview (top traffic areas)
- Visitor session duration (per hot zone)
- Intuitive colouring
Effortless Preview Thanks To
Let's discuss how this fits your business needs
Book a call